Dubai Gold Sales
by Dafah Ahmad
(Depok, West Java, Indonesia)


The line graph shows estimated sales of gold in Dubai for 12 months in 2002 in millions of Dirhams
The line graph gives information about gold trade in Dubai from January to December of the year 2002.
It is clear in the graph that the gold sales reached its highest level of selling in March and it fell to its lowest level between July and September.
In the beginning of the year the gold price stood at 200 millions of dirhams and it increased slightly in the following month before the figures showed a sharp rise in March, with the selling was about 350 million of dirhams.
In contrast, after the trend reached a peak in March with its highest gold trading, the figures decreased gradually for the next 4 months from April, May, June and July with 250, 200, 150, and 120 million of dirhams, respectively. Surprisingly enough, there was a strong recovery for the Dubai gold sales in August with the selling was about 200 million of dirhams and it fluctuated before it was levelling off until the end of the year and the trading closed nearly 200 million of dirhams in December.
Please can someone give me feedback on my line graph about Dubai Gold Sales. Thanks.
Comments for Dubai Gold Sales
|
||
|
||
|
||
|
||
|
||
|
||
|
||
|
||
|
||
|
||
|
||
hala
the line graph illustrate the sales of gold in Dubai in 2002 in millions of Dirhams. overall, in March 2002 the sales of gold was in the highest profit for sales estimate 350 million Dirhams
as we can see, Jan is the first month in this year and the sales began at 200 million and had increased in Feb to half of the sales in Jan which is almost 250 . in Mar the sales had doubled rose at 350 million . in Apr sales fell as before in Feb which 250 million.
in May, Jun, Jul had gradually fallen, the estimated sales were between 200 and 100 million Dirhams . in Aug the sales went up significantly to 200 million Dirhams. in Sep sales dropped again to almost 110 million . in Oct rose approximately to 170 million Dirhams. the sales didn't move from Oct's sales and the sales were between 170,180 and 190 million Dirhams in the last three months in this year.
Before you go...
Check out the IELTS buddy
Band 7+ eBooks & Courses
Band 7+ eBooks
"I think these eBooks are FANTASTIC!!! I know that's not academic language, but it's the truth!"
Linda, from Italy, Scored Band 7.5


IELTS Modules:
Other Resources:


Recent Articles
-
Decreasing House Sizes Essay
Apr 06, 24 10:22 AM
 In this decreasing house sizes essay for IELTS you have to discuss the pros and cons of smaller house sizes and gardens.
 -
Latest IELTS Writing Topics - Recent Exam Questions
Apr 04, 24 02:36 AM
 See the latest IELTS writing topics from the exam which have been posted by candidates who've taken the test.
 -
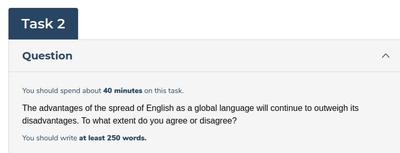
IELTS Essay: English as a Global Language
Apr 03, 24 03:49 PM
 Evaluate my writing task for academic ielts, pls Academic IELTS writing task 1 --------------------------------------------------------------------------------------------------------------


Copyright © IELTSbuddy All Rights Reserved
IELTS is a registered trademark of University of Cambridge, the British Council, and IDP Education Australia. This site and its owners are not affiliated, approved or endorsed by the University of Cambridge ESOL, the British Council, and IDP Education Australia.