Task 1: Line Graph - Value of Exports
by sohaib


|


|
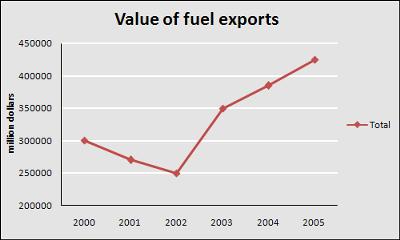
The graph below shows the total value of exports and the value of fuel, food and manufactured goods exported by one country from 2000 to 2005.
Summarize the information by selecting and reporting the main features, and make comparisons where relevant.
The first line graph illustrates figures for total exports by a country,while the second line graph compares figures for selected exports by the same country betwen 2000 and 2005.
Overall,total value of exports increased over this period shown.While the value of fuel export showed a significant decrease,there was a slight increase in the value of manufactured goods exported over a period of five years.
In 2000,value of total exports was 300000 million dollars.It fell in 2002 before rising again in 2003,at about 350000.Finally in 2005,total value of exports peaked at above 400000 million dollars.
The second graph shows that in 2000 the figure for fuel export was highest ,at about 45000 million dollars,whereas the figure for food export was lowest,at under 10000 million dollars.
In 2002,the value of fuel exported fell to 30000 million dolars,while the value of manufactured goods exported rose slightly to about 25000 million dollars.
By 2005,the value of manufactured goods exported were highest among all exports.Over this period of five years,the figures for fuel and goods exports fluctuated,whie the figure for food export remained almost stable,at under 10000 million dollars.
PS:THERE IS A MISTAKE IN THE HEADING OF FIRSTGRAPH.IT IS VALUE OF TOTAL EXPORTS INSTEAD OF VALUE OF FUEL EXPORT
=====================
IELTS Buddy
Feedback:
Here is a corrected version:
The first line graph illustrates figures for total exports by a country, while the second line graph compares figures for selected exports by the same country between 2000 and 2005.
Overall, the total value of exports increased over this period shown. While the value of fuel exports showed a significant decrease, there was a slight increase in the value of manufactured goods exported over a period of five years, and food remained the same.
In 2000, the value of total exports was
The second graph shows that in 2000 the figure for fuel exports was highest, at about 45000 million dollars, whereas the figure for food exports was lowest, at under 10000 million dollars.
From 2000 to 2002, the value of fuel exported fell to 30000 million dolars, while the value of manufactured goods exported rose slightly to about 25000 million dollars.
By 2005, the value of manufactured goods exported had overtaken that of fuel exports and was the highest among all exports. Meanwhile, the figure for food export remained almost stable, at under 10000 million dollars over the whole period.
========================
Further Commnents:
I added the bit about food as it seems odd to mention 3 of them but not the 4th. Of course in the overview you don’t have to mention everything, you can pick out one most important trend if there is one.
You miss some articles – “the” in a few places (that it just a small point though).
You need to be careful when you write about the changes over time though.
Regarding the first graph, remember to think about ‘periods of time’ – it didn’t fall in ‘2000’ (this is not a period so it can’t change).
It fell from 2000-2002. In 2002 it ‘stood at’ 250,000.
You’ll see I made some other corrections regarding this.
“Over this period of five years,the figures for fuel and goods exports fluctuated,” – this is not right – a fluctuation is when something keeps going up and down – these don’t really do that so I don’t think they can be classed as a ‘fluctuation’.
Overall though, you have quite good organization, you mention all the key things, and have some good grammar. So I think if you just correct your errors when you write about time frames you should do ok.
Task 1 Sample Answer: Value of Exports
by Puma_andev - Rita Yem
(Shanghai, China)

The graph below shows the total value of exports and the value of fuel, food and manufactured goods exported by one country from 2000 to 2005.


|


|
These following graphs indicate the value of food, fuel, manufactured goods and the total value of exports sold overseas by one country between 2000 and 2005.
As we can observe the first graph reveals that the total value of exports slightly diminished from 2000 until 2002. However, it sharply escalated in four subsequent years, indicating the total profit of exports at 350000 million dollars position in 2003 and almost 450,000 million dollars in 2005 respectively.
The second graph shows us that the export of food remained nearly the same throughout the period, fluctuating bellow 5,000 million dollars. In comparison to the export of food, the export of fuel and manufactured goods has better showings. The export of fuel was the most valued one amongst others making up 45,000 million dollars in 2000. However, it dwindled noticeably and in 2005 was merely half of that amount. The export of manufactured goods was altering during the time designating less than 20,000 million dollars in 2000 and little more than 20,000 in 2005.
==================================================
IELTS buddy
Corrected Version:
These following The graphs indicate the value of food, fuel, manufactured goods and the total value of exports sold overseas by one country between 2000 and 2005. Overall, the value of food and manufactured good changed little over the period, whereas the value of fuel fell markedly.
As we can observe, the first graph reveals that the total value of exports declined slightly diminished from 2000 until 2002. However, it sharply escalated in the four subsequent years, indicating the showing a total profit of exports at 350000 million dollars position in 2003 and almost 450,000 million dollars in 2005 respectively.
The second graph shows us that the export of food remained nearly the same throughout the period, fluctuating bellow 5,000 million dollars. In comparison to the export of food, the export of fuel and manufactured goods has better showings showed more significant changes. The export of fuel was the most valued one amongst others the three, making up 45,000 million dollars in 2000. However, it dwindled noticeably and in 2005 was merely half of that amount. The export of manufactured goods was altering fluctuated minimally during the time, designating starting at less than 20,000 million dollars in 2000 and finishing at little more than 20,000 in 2005.
FURTHER COMMENTS
Overall it's a good answer as you have some varied sentence structures and you mention all the key information. You also make some good comparisons of each feature, rather than describing each in isolation.
Overview
Make sure you describe the overall general trends at some point in the graph - I've added this to the introduction.
Language of Change
Be careful you are using the right language - you use some which did not work, such as diminishing, altering and disignating.
"Respectively"
You don't have to use the word respectively where did as you are describing one thing. It is used like this:
Exports increased in Italy, France and Spain, by 5%, 7%, and 3% respectively.
Respectively is telling you that the numbers are being shown in the same order as the countries so we know what goes with what.
Comments for Task 1 Sample Answer: Value of Exports
|
||
|
||
|
||
|
||
IELTS Sample Task 1: Value of Exports
by dravid
(thailand )

The graph shows the total value of exports and the value of fuel, food and manufactured goods exported by one country from 2000 to 2005.


|


|
The graphs indicate the value of food, fuel, manufactured goods and the total value of exports sold overseas by one country between 2000 and 2005.
Regardless of plunge between 2000 and 2002, there was a considerable growth in the value of fuel exported over the four subsequent years, reaching 350000 million dollars in 2003 before pushing the figure further to a new height well above 400000 million dollars by the year 2005.
According to the second chart, nearly 45000 million a worth of fuel was exported, but this number fell significantly and, by 2005, this had fallen to 20000 million dollars. By contrast, export of manufactured goods rose from about 17000 million dollars to 25000 million dollars between 2000 and 2002. Despite a slight fall in 2003, there was a marked upward trend for the next years showing a little more than 20,000 in 2005. In terms of food, this remained relatively stable throughout the period, fluctuating bellow 5,000 million dollars.
==================================================
IELTS buddy
Feedback
Corrected Version:
The graphs indicate illustrate the value of food, fuel, manufactured goods and the total value of exports sold overseas by one country between 2000 and 2005.
(You need to identify the main trends in the graph here before you go on to your detailed decription - follow this link for more advice on this: How to write an IELTS Task 1 Graph)Regardless of Despite the plunge between 2000 and 2002, there was a considerable growth in the value of fuel exported over the four subsequent years, reaching 350000 million dollars in 2003, before pushing the figure and rising further to a new height well above 400000 million dollars by the year 2005.
According to the second chart, nearly 45000 million worth of fuel was exported, but this number fell significantly and, by 2005, this had fallen to 20000 million dollars. By contrast, export of manufactured goods rose from about 17000 million dollars to 25000 million dollars between 2000 and 2002. Despite a slight fall in 2003, there was a marked upward trend for the next years showing a little more than 20,000 in 2005. In terms of food, this remained relatively stable throughout the period, fluctuating below 5,000 million dollars.
==================================================
As you can see, I have not had to make many corrections to the graph. It's a very good answer, with all the important featuers explained, some comparisons made, and some good grammatical structures.
The only important thing missing is providing an overview of the main trends at the beginning.
Also, do not use this phrase: "pushing the figure"
Thanks
Comments for IELTS Sample Task 1: Value of Exports
|
||
|
||
|
||
Before you go...
Check out the IELTS buddy
Band 7+ eBooks & Courses

Band 7+ eBooks
"I think these eBooks are FANTASTIC!!! I know that's not academic language, but it's the truth!"
Linda, from Italy, Scored Band 7.5


IELTS Modules:
Other Resources:


Recent Articles
-
Decreasing House Sizes Essay
Apr 06, 24 10:22 AM
 In this decreasing house sizes essay for IELTS you have to discuss the pros and cons of smaller house sizes and gardens.
 -
Latest IELTS Writing Topics - Recent Exam Questions
Apr 04, 24 02:36 AM
 See the latest IELTS writing topics from the exam which have been posted by candidates who've taken the test.
 -
IELTS Essay: English as a Global Language
Apr 03, 24 03:49 PM
 Evaluate my writing task for academic ielts, pls Academic IELTS writing task 1 --------------------------------------------------------------------------------------------------------------


Copyright © IELTSbuddy All Rights Reserved
IELTS is a registered trademark of University of Cambridge, the British Council, and IDP Education Australia. This site and its owners are not affiliated, approved or endorsed by the University of Cambridge ESOL, the British Council, and IDP Education Australia.