IELTS Sample Task 1 Line Graph: Visits to two new music sites on the web
by loki
(pacquiao)
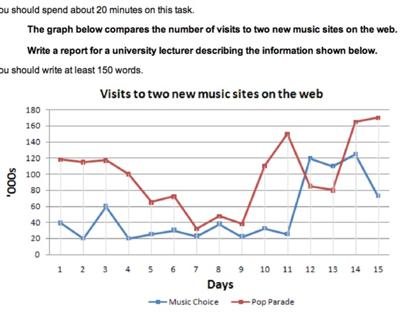

The line graph delineates information in comparison to the number of visits to two new music sites on the web.
On day 1, one can favourably notice that Pop parade outweighs the number of visit of the Music Choice by having 120'000s vs 40'000s. There is a little fluctuation in Pop parade's visit from day 1 to day 3. It descends from day 3 to day 5. Over a period of 2 days only, the number of visit marks half of the number of visit from the first day. A See-saw trend can be seen as well from the 5th day to the 9th. Interestingly, Pop parade's listeners catapulted to almost 150'000s but then again it fluctuated until the 15th day with an accrued 170'000s number of visit.
However, the Music Choice's trend can be described as a roller-coaster ride. From day 1 to day 11, the number of the listeners ranges from 20'000s to 60'000s. Surprisingly, the number of visits rocketed to 120'000s and ends on a downward slope leaving an amount of 70,000s number of visit on the last day.
Based on the facts given, people have this commonality on visiting and enjoying listening to Pop parade music over the Music Choice.
==================================================
IELTS buddy
Feedback
Corrected Version:
The line graph
On day 1,
However, the Music Choice's trend can be described as a roller-coaster ride more eratic. From day 1 to day 11, the number of the listeners ranges from 20'000 to 60'000. Surprisingly, the number of visits rockets to 120'000 and ends on a downward slope leaving an amount of 70,000 number of visits on the last day.
Based on the facts given, people have this commonality on visiting and enjoying listening it is evident that throughout the period people like to visit Pop Parade over the Music Choice.
==================================================
Your answer is good in that it is easy to read and you have clearly divided up the information. There are not too many grammar errors either.
However, as I explain below it would benefit from some more comparison between the two sites.
The Introduction
To describe what the graph shows, you must paraphrase the title. You copy too much here:
...the number of visits to two new music sites on the web.
A few words and short phrases is ok, but this would get deducted from your word count.
You can see in the introduction I have changed it.
Tenses
Careful with your tenses - if you look you'll see you switch between present and past tense. With this graph it is ok to use either, as you are not specifically given a timeframe in the past, but you should choose one and stick with it.
Comparing and Contrasting
A good answer will compare the different data as the question asks you to do. You do compare the visits:
...visits to Pop Parade outweigh the number of visits of Music Choice..
However, the Music Choice's trend can...
However, your answer would benefit from some more direct comparison between the two. For example, pointing out how they started at very different levels at the beginning, they were more similar in the middle, and both increase sharply at the end.
Vocabulary
one can favourably = too personal, keep it 'academic'
See-saw trend /roller-coaster ride = again, these are too informal.
120'000s = 120,000 - no 's'.
Comments for IELTS Sample Task 1 Line Graph: Visits to two new music sites on the web
|
||
|
||
|
||
|
||
|
||
|
||
|
||
|
||
|
||
|
||
|
||
|
||
|
||
IELTS Line Graph - Number of Visits to Two New Music Sites
by Adalberto Ferrari
(Italy)


The graph below compares the number of visits to two new music sites on the web. Write a report for a university lecturer describing the information shown below. You should write at least 150 words.
The line graph shows the amount of visits received by two music websites, Music Choice and Pop Parade, in a period of 15 days.
Overall, it is clear that the most visited website is Pop Parade, but for few days the trend was switched.
Going to detail, Pop Parade visits at day 1 accounted as 120k, much higher than Music Choice, with only a third of the visits (40k).
At day 3, Pop Parade registered a steady decline in visits, but still more than the ones received by Music Choice, which reached a peak of 60k visits.
Pop Parade continued its erratic decrease until day 11, when a sharp growth reached more than 140k visits; in the same period, visits for Music Choice fluctuated between 20k and 40k views.
After day 11, Pop Parade’s popularity fell to 80k visits for two days, whereas Music Choice resulted to be the most favourite website.
Finally, from day 13 to day 15, Music Choice plunged to reach nearly 70k views; on the contrary, Pop Charts suddenly rose to reach just over 160k visits, continuing a constant increase at day 15.
(words: 187)
You can provide feedback on this graph about the number of visits to two new music sites on the web and help the candidate improve their score by clicking the comments link below.
Before you go...
Check out the IELTS buddy
Band 7+ eBooks & Courses
Band 7+ eBooks
"I think these eBooks are FANTASTIC!!! I know that's not academic language, but it's the truth!"
Linda, from Italy, Scored Band 7.5


IELTS Modules:
Other Resources:


Recent Articles
-
Decreasing House Sizes Essay
Apr 06, 24 10:22 AM
 In this decreasing house sizes essay for IELTS you have to discuss the pros and cons of smaller house sizes and gardens.
 -
Latest IELTS Writing Topics - Recent Exam Questions
Apr 04, 24 02:36 AM
 See the latest IELTS writing topics from the exam which have been posted by candidates who've taken the test.
 -
IELTS Essay: English as a Global Language
Apr 03, 24 03:49 PM
 Evaluate my writing task for academic ielts, pls Academic IELTS writing task 1 --------------------------------------------------------------------------------------------------------------


Copyright © IELTSbuddy All Rights Reserved
IELTS is a registered trademark of University of Cambridge, the British Council, and IDP Education Australia. This site and its owners are not affiliated, approved or endorsed by the University of Cambridge ESOL, the British Council, and IDP Education Australia.