- Home
- IELTS Quiz
- Pie Chart Gap Fill
IELTS Pie Chart Exercise
This IELTS pie chart exercise gives you the chance to practice the language for this type of chart.
This will help to improve your vocabulary knowledge, range and flexibility when you are describing a pie chart. It will also help to improve your grammar.
Pie Chart Language Points
There is no time change in the chart, so the focus is on the language of comparison and contrast. Although the information is presented here as a pie chart, it is similar to language you would use for other charts where you compare or contrast.
Some language that is particularly common to pie charts though is using the the proportion of.
When you learn language for a task 1, it is a good idea to look at 'chunks' of language rather than single words, or in other words collocations. This will improve your writing skills.
So for example, you would learn the phrase accounted for rather than just accounted or the proportion of rather than the proportion.
IELTS Pie Chart Exercise: Gap Fill
Read the question and look at the table. Then decide which word should be placed in the gap.
You should spend about 20 minutes on this task.
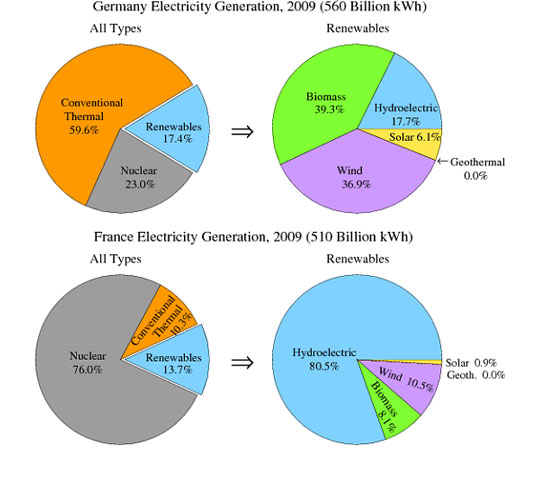
The pie charts show the electricity generated in Germany and France from all sources and renewables in the year 2009.
Summarise the information by selecting and reporting the main features and make comparisons where relevant.
Write at least 150 words.
| was lower | was very different | at approximately | the remaining | compare |
| the proportion of | was far higher | accounted for | one fifth | whereas |
IELTS pie chart gap fill exercise
More Academic Task 1 Quizzes and Gap Fills:
Take an IELTS Quiz to test your IELTS knowledge
IELTS Quizzes to test and train you on the writing task and task 2 of the IELTS test. Gap fills and multiple choice.
IELTS Table Completion Exercise: Choose the word to go in the gap
In this IELTS table completion exercise you can improve your task 1 language flexibility. You have to choose the correct word for the gap.
IELTS Process Exercise: Master your skills for the passive voice
IELTS Process Exercise Gap Fill: This teaches you how to use the passive voice for IELTS Task 1
IELTS Graph Data Quiz: Learn how to use phrases to approximate
Understand IELTS graph data and Increase your flexibility to describe IELTS graph data with this online quiz. In the drag and drop quiz, match the percentage with the phrase.
IELTS Task 1 Verb Quiz: Practice for processes and the passive voice
In this IELTS Task 1 Verb Quiz you can test yourself on choosing the right verb in a sample process diagram. This provides practice with the passive voice.
Comments
Any comments or questions about this page or about IELTS? Post them here. Your email will not be published or shared.

Band 7+ eBooks
"I think these eBooks are FANTASTIC!!! I know that's not academic language, but it's the truth!"
Linda, from Italy, Scored Band 7.5


Bargain eBook Deal!
30% Discount


All 4 Writing eBooks for just $25.86
Find out more >>
IELTS Modules:
Other Resources:


Recent Articles
-
Free IELTS Essay Checker: Instant and No Login Required
Mar 26, 26 08:30 AM
Free IELTS essay checker giving you an instant overall band score, detailed scores for all IELTS writing criteria, example errors, and clear suggestions to improve your Task 2 essay. -
IELTS Bar Chart: Average Number of Coastal Flood Events per Year
Mar 10, 26 05:34 AM
 The chart below shows the number of flood events in four different cities in the United States during four different periods. The bar graph depicts the
 -
Should Everyone Learn English
Mar 10, 26 05:32 AM
I would be pleased if someone could provide feedback. I want to know if my essay well-structured and the exact band. Learning English at school is often


Important pages
IELTS Writing
IELTS Speaking
IELTS Listening
IELTS Reading
All Lessons
Vocabulary
Academic Task 1
Academic Task 2
Practice Tests
Connect with us

Before you go...
30% Discount - Just $25.86 for all 4 Writing eBooks

Copyright © IELTSbuddy All Rights Reserved
IELTS is a registered trademark of University of Cambridge, the British Council, and IDP Education Australia. This site and its owners are not affiliated, approved or endorsed by the University of Cambridge ESOL, the British Council, and IDP Education Australia.