- Home
- Sample Graphs
- IELTS Bar and Pie Chart
IELTS Bar and Pie Chart
This IELTS bar and pie chart compares the numbers of men and women attending evening courses and their ages.
Organising Two Charts
When you have two charts together, the best thing to do in most cases is describe one after the other rather than trying to combine information.
Doing that can be confusing to write, takes longer, and can make it confusing to read. Often it is completely separate information anyway so needs to be described separately.
So in the IELTS bar and pie chart, firstly describe the bar chart, then the pie chart.
It may be that one of the charts will have more information to describe. In this IELTS bar and pie chart for example, the first one is likely to make up most of your description.
IELTS Bar and Pie Chart
You should spend about 20 minutes on this task.
The bar chart below shows the numbers of men and women attending various evening courses at an adult education centre in the year 2009. The pie chart gives information about the ages of these course participants.
Summarise the information by selecting and reporting the main features, and make comparisons where relevant.
Write at least 150 words.


Model Answer
The bar graph presents the numbers of males and females at an adult education center who attended different evening classes in 2009. The pie graph displays data on the students’ ages. Overall, females were seemingly more interested in the classes than men. Age-wise, night classes appealed more to older people than younger people.
As seen in the bar graph, more females attended the classes than males. The most popular class for women was in languages (40), which saw twice as many women attending as men. Painting courses were also popular, with more equal attendance, though women still outnumbered men, at 30 and 25 respectively. Drama again witnessed double the attendance for women over men. The only course with more men was sculpture, for which 10 men signed up versus only 5 women.
Regarding age, the course participants were predominantly from the seniors, those 50 years old and above, and people in their forties with 42% and 26%, respectively. Next came the thirty-year-olds (16%) and twenty-year-olds (11%). Very few students attending the evening classes were under 20 years of age.
(179 Words)
Comments
The IELTS bar and pie chart is organised well as it clearly explains the information from both charts.
The bar chart is clearly divided up into firstly discussing the classes more popular with women and finally the class that men prefer.
Then response then discusses the information from the pie chart.
Data is used to support the description and relevant compare and contrast language for graphs is used.
More on a Mix of Graphs:
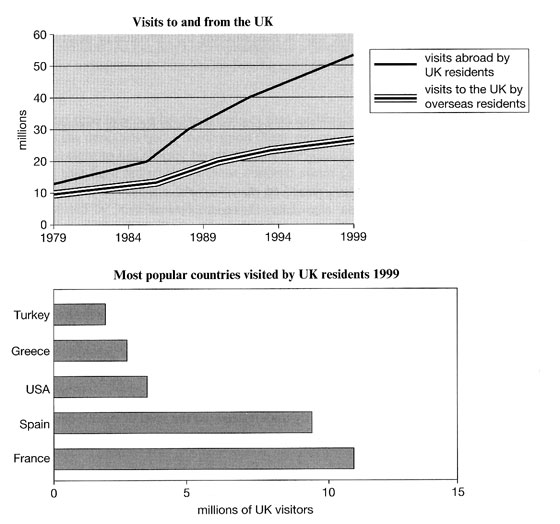
IELTS Bar and Line Graph: How to describe two graphs together
This Bar and Line Graph example shows you how you can write about two charts together in the IELTS test for task 1, with strategies and techniques.
IELTS Line Graph and Pie Chart: Describing two charts together
Explaining an IELTS Line Graph and Pie Chart together is sometimes necessary in the test. Check out an example, model answer and comments given on the graphs.
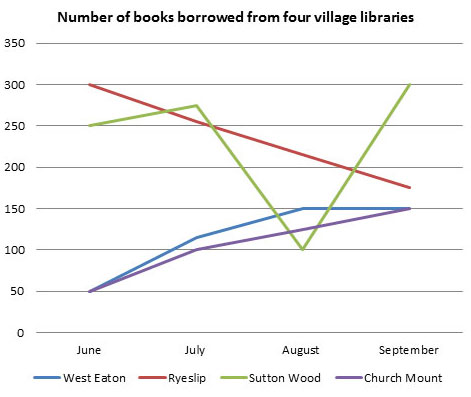
IELTS Line and Bar Chart Sample Answer: A mix of graphs
Sometimes an IELTS line and bar chart needs to be described together in task 1. You need certain tactics and strategies to tackle this. View a model answer.
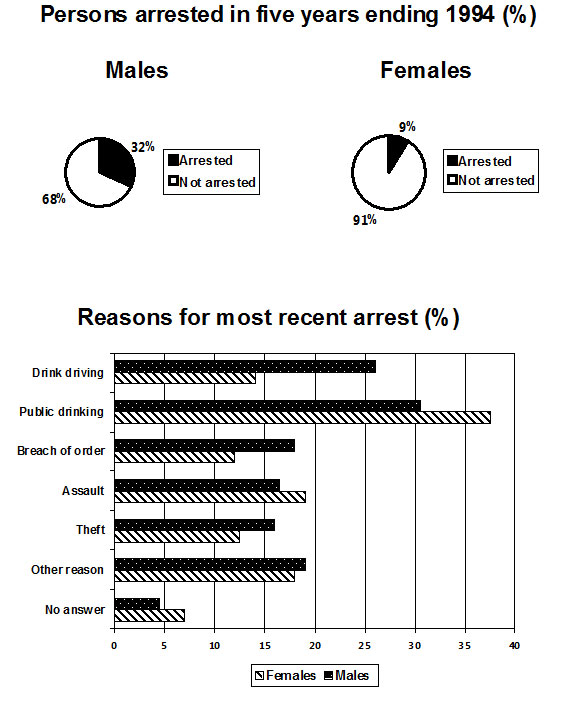
IELTS Pie and Bar Chart: Two charts combined in one question
Here you can view an IELTS Pie and Bar Chart together in one question on persons arrested and reasons. In this type of question you should write about each graph in turn. A model answer is provided.
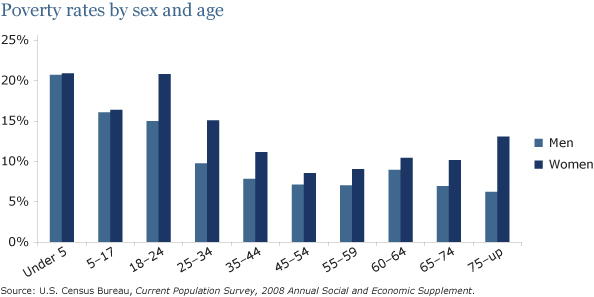
IELTS Pie and Bar Chart: Describing two graphs in a task 1
An IELTS Pie and Bar Chart have been included together in this Task 1 sample. This can cause difficulties for some in the test so view the sample answer to see how to answer this type of graph.
Comments
Any comments or questions about this page or about IELTS? Post them here. Your email will not be published or shared.
Before you go...
Check out the IELTS buddy
Band 7+ eBooks & Courses
Band 7+ eBooks
"I think these eBooks are FANTASTIC!!! I know that's not academic language, but it's the truth!"
Linda, from Italy, Scored Band 7.5


IELTS Modules:
Other Resources:


Recent Articles
-
Paraphrasing in the IELTS Test: Speaking and Writing
May 03, 24 10:26 AM
Paraphrasing in the IELTS test is important for both speaking and writing. In this lesson we have tips on how to paraphrase. -
Fillers for IELTS Speaking: Avoid 'Eh', Uhm', 'You know'.
Apr 27, 24 05:48 AM
fillers for ielts speaking -
Decreasing House Sizes Essay
Apr 06, 24 10:22 AM
 In this decreasing house sizes essay for IELTS you have to discuss the pros and cons of smaller house sizes and gardens.


Copyright © IELTSbuddy All Rights Reserved
IELTS is a registered trademark of University of Cambridge, the British Council, and IDP Education Australia. This site and its owners are not affiliated, approved or endorsed by the University of Cambridge ESOL, the British Council, and IDP Education Australia.