- Home
- Task 1 Lessons & Tips
- Common Mistake
IELTS Graphs: Avoiding a Common Mistake
Look carefully at the IELTS graphs below and their titles. Underneath each is a brief descriptive sentence about the graphs.
What is wrong with them?
You can also watch a video of this lesson:


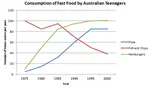
From 1975 to 2000, hamburgers increased dramatically from 10 to 100 times per year. At the same time, fish and chips fell significantly to just under 40.

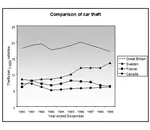
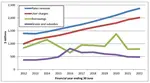
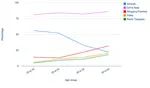
While buses fell from just over 25% to around 16% in 2000, cars increased dramatically to over 35%. Meanwhile, bikes fell over this time frame.
Did you find what the errors were?
Can "hamburgers" increase and "fish and chips" fall? Can a "car" increase, or a "bus" and a bike fall?
No, but the consumption of hamburgers or fish and chips can fall or rise, and the use of a car, bike or bus can increase or decrease.
There are a number of ways that the sentences in the IELTS graphs could have been written correctly, but here are some possibilities:
From 1975 to 2000, the consumption of hamburgers increased dramatically from 10 to 100 times per year. At the same time, the number of times that fish and chips were eaten fell significantly to just under 40.
While bus usage fell from just over 25% to around 16% in 2000, cars as a mode of travel increased dramatically to over 35%. Meanwhile, the use of bikes fell over this time frame.
Check Your Subject
When you are analysing your task 1 before you write about it, look very carefully to identify what the subject is i.e. what is it exactly that is being measured?
A common mistake when writing about IELTS graphs in task 1 of the test is to get the subject wrong.
- The first graph is about the consumption of fast foods.
- The second graph is about the use of four types of transport.
Getting this wrong will significantly detract from your response to the task.
Practice
Below are some examples of sentences taken from IELTS graphs where the subject is wrong. At the end of the sentence in brackets is a word which is missing.
Have a go at writing the corrected sentence in the box using the word (you may have to add in some more information such as 'the number of' or change the form of the missing word).
There are different ways that it can be corrected, but view some possible answers by clicking on the link below each question.
1. Cinema's increased from 2000 to 2005. (attendance)
- Cinema attendance increased from 2000 to 2005.
- The number of people attending / who attended the cinema increased from 2000 to 2005.
2. Saudi Arabia fell significantly to 270 million barrels a year. (oil production).
- Oil production in Saudi Arabia fell significantly to 270 million barrels a year.
- The amount of oil produced in Saudi Arabia fell significantly to 270 million barrels a year.
- Saudi Arabia's oil production fell significantly to 270 million barrels a year.
3. 2000 to 2010 saw DVDs drop from 70% to 60%. (purchased).
- 2000 to 2010 saw the number of DVDs purchased drop from 70% to 60%.
- 2000 to 2010 saw the purchase of DVDs drop from 70% to 60%.
There are only a few examples here, but the key point is to make sure you look at what you are being asked to describe in the graph very carefully.
More Task 1 Academic Lessons:
Lesson on Writing IELTS Line Graphs
This lesson on writing IELTS line graphs provides you with the skills to write a high scoring graph.
Prepositions in Graphs Quiz: Between; from; to; at; of; in; with; by
Prepositions in Graphs: Practice using prepositions in the IELTS test. View a model answer and practice using a gap fill.
Describing an IELTS task 1 graph over time
This lesson shows you how to write an IELTS task 1 graph or chart that is over time.
Tips for Organising an IELTS Line Graph
Organising an IELTS Line Graph - This lesson shows you have to improve the coherency of your graph in order to achieve a high band score.
IELTS Pie Chart Strategies and Tips for a Band 7, 8 or 9
This IELTS pie chart lesson provides you with tips and advice on how to describe an IELTS Pie Chart in order to get a Band 7, 8 or 9.


Comments
Any comments or questions about this page or about IELTS? Post them here. Your email will not be published or shared.

Band 7+ eBooks
"I think these eBooks are FANTASTIC!!! I know that's not academic language, but it's the truth!"
Linda, from Italy, Scored Band 7.5


Bargain eBook Deal!
30% Discount


All 4 Writing eBooks for just $25.86
Find out more >>
IELTS Modules:
Other Resources:


Recent Articles
-
IELTS Opinion and Argument Skills
Dec 05, 25 11:44 AM
Improve your IELTS opinion and argument skills with a series of topic-based lessons that include listening practice, key ideas, useful vocabulary, and natural opinion language. -
IELTS Debate on Rural to Urban Migration
Dec 05, 25 09:45 AM
Explore an IELTS Debate on Rural to Urban Migration with clear arguments for and against, useful vocabulary, and practice materials to help you develop strong speaking and writing skills for the IELTS… -
IELTS Debate on Remote Working
Nov 28, 25 09:12 AM
Listen to an IELTS debate on remote working, explore the full transcript, and learn key vocabulary. Improve your listening skills and develop ideas for IELTS Speaking Part 3 and Writing Task 2.

Important pages
IELTS Writing
IELTS Speaking
IELTS Listening
IELTS Reading
All Lessons
Vocabulary
Academic Task 1
Academic Task 2
Practice Tests
Connect with us

Before you go...
30% Discount - Just $25.86 for all 4 Writing eBooks

Copyright © IELTSbuddy All Rights Reserved
IELTS is a registered trademark of University of Cambridge, the British Council, and IDP Education Australia. This site and its owners are not affiliated, approved or endorsed by the University of Cambridge ESOL, the British Council, and IDP Education Australia.