- Home
- Task 1 Lessons & Tips
- Ielts Pie Chart
How to Write an IELTS Pie Chart
This lesson will provide you with tips and advice on how to write an IELTS pie chart for task 1.
To begin, take a look at the pie chart below, and then answer the quiz questions.
If you prefer or if you want extra tips you can also view this lesson in a video (but don't forget afterwards to do the quizzes on this page that give you the language practice!):
The Task:
You should spend about 20 minutes on this task.
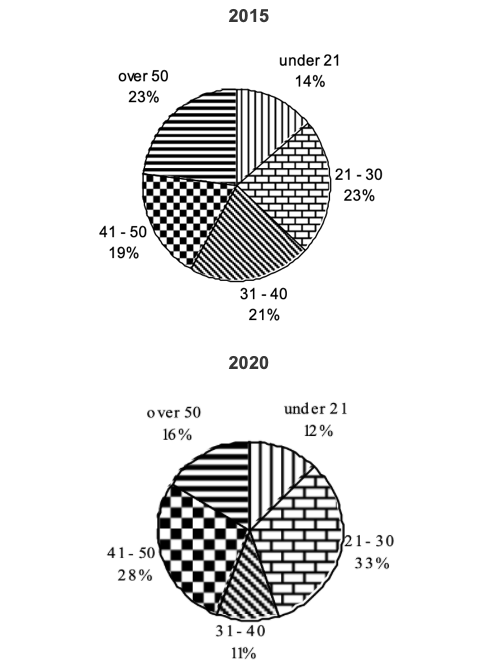
The pie charts show the main reasons for migration to and from the UK in 2007.
Summarise the information by selecting and reporting the main features and make comparisons where relevant.
Write at least 150 words.
Answer these questions about the IELTS pie chart:
Now take a look at a model answer:

The pie charts illustrate the primary reasons that people came to and left the UK in 2007. At first glance it is clear that the main factor influencing this decision was employment.
Having a definite job accounted for 30 per cent of immigration to the UK, and this figure was very similar for emigration, at 29%. A large number of people, 22%, also emigrated because they were looking for a job, though the proportion of people entering the UK for this purpose was noticeably lower at less than a fifth.
Another major factor influencing a move to the UK was for formal study, with over a quarter of people immigrating for this reason. However, interestingly, only a small minority, 4%, left for this.
The proportions of those moving to join a family member were quite similar for immigration and emigration, at 15% and 13% respectively. Although a significant number of people (32%) gave ‘other’ reasons or did not give a reason why they emigrated, this accounted for only 17% with regards to immigration.
(173 words)
Choose the most important points to write about first
These will usually be the largest ones. As you can see in the model answer, definite job, looking for work, and formal study were all written about first, in order of importance, as these are the main reasons that were chosen for moving.
Items such as ‘other’ are usually less important and account for small amounts, so can be left till the end.
Make it easy to read
When you write a task 1, you should always group information in a logical way to make it easy to follow and read.
With an IELTS pie chart, the most logical thing to do is usually to compare categories together across the charts, focusing on similarities and differences, rather than writing about each chart separately.
If you write about each one separately, the person reading it will have to keep looking between the paragraphs in order to see how each category differs.
Vary your language
As with any task 1, this is important. You should not keep repeating the same structures. The key language when you write about pie charts is proportions and percentages.
Common phrases to see are "the proportion of…" or "the percentage of…"
However, you can also use other words and fractions. These are some examples from the model answer:
- A large number of people
- over a quarter of people
- a small minority
- A significant number of people
- less than a fifth
This table presents some examples of how you can change percentages to fractions or ratios:
| Percentage | Fraction |
|---|---|
| 80% | four-fifths |
| 75% | three-quarters |
| 70% | seven in ten |
| 65% | two-thirds |
| 60% | three-fifths |
| 55% | more than half |
| 50% | half |
| 45% | more than two fifths |
| 40% | two-fifths |
| 35% | more than a third |
| 30% | less than a third |
| 25% | a quarter |
| 20% | a fifth |
| 15% | less than a fifth |
| 10% | one in ten |
| 5% | one in twenty |
You can improve your flexibility in using these words or test your knowledge of them in this percentage and proportions quiz.
If the percentages are not exact as above, then you can use qualifiers to make sure your description remains accurate. Here are some examples:
| Percentage | Qualifier |
|---|---|
| 77% | just over three quarters |
| 77% | approximately three quarters |
| 49% | just under a half |
| 49% | nearly a half |
| 32% | almost a third |
This table presents some examples of how you can change percentages to other phrases:
| Percentage | proportion / number / amount / majority / minority |
|---|---|
| 75% - 85% | a very large majority |
| 65% - 75% | a significant proportion |
| 10% - 15% | a minority |
| 5% | a very small number |
The words above are interchangeable, though number is for countable nouns and amount is for uncountable nouns.
You can practice or test yourself with the language used to approximate figures in this online quiz.
More Task 1 Academic Lessons:
Useful Language for IELTS Graphs
This useful language for IELTS graphs looks at phrases for introducing graphs and describing changes
Tips for Organising an IELTS Line Graph
Organising an IELTS Line Graph - This lesson shows you have to improve the coherency of your graph in order to achieve a high band score.
Lesson on Writing IELTS Line Graphs
This lesson on writing IELTS line graphs provides you with the skills to write a high scoring graph.
How to Describe an IELTS Academic Writing Task 1 Graph
IELTS Academic Writing Task 1: This lesson describes in a simple way how you should describe a graph for the academic part of the test for task 1. You need an introduction, overview and body paragraphs. These simple steps will show you how, and how to get a high score.
Learn Compare and Contrast Language for IELTS Graphs
Compare and Contrast Language: In the academic IELTS task 1, you have to know the right language if you want to get a band 7 or higher. Practice your IELTS language for bar charts in this task 1 writing lesson.


Comments
Any comments or questions about this page or about IELTS? Post them here. Your email will not be published or shared.

Band 7+ eBooks
"I think these eBooks are FANTASTIC!!! I know that's not academic language, but it's the truth!"
Linda, from Italy, Scored Band 7.5

Bargain eBook Deal!
30% Discount

All 4 Writing eBooks for just $25.86
Find out more >>
IELTS Modules:
Other Resources:


Recent Articles
-
IELTS Listening Section 1 Practice
Jul 11, 25 06:22 AM
Take an IELTS listening section 1 practice test to improve your skills for the first part of this module. -
Latest IELTS Writing Topics - Recent Exam Questions
Jun 26, 25 05:55 AM
 See the latest IELTS writing topics from the exam which have been posted by candidates who've taken the test.
 -
IELTS Listening Section 3 Practice
Jun 05, 25 10:27 AM
IELTS listening section 3 practice - take tests like the real exam to improve your skills for each section.


Important pages
IELTS Writing
IELTS Speaking
IELTS Listening
IELTS Reading
All Lessons
Vocabulary
Academic Task 1
Academic Task 2
Practice Tests
Connect with us

Before you go...
30% Discount - Just $25.86 for all 4 Writing eBooks

Copyright © IELTSbuddy All Rights Reserved
IELTS is a registered trademark of University of Cambridge, the British Council, and IDP Education Australia. This site and its owners are not affiliated, approved or endorsed by the University of Cambridge ESOL, the British Council, and IDP Education Australia.