Task 1: Bar Chart Reasons for Studying
by lion
(Bukhara)
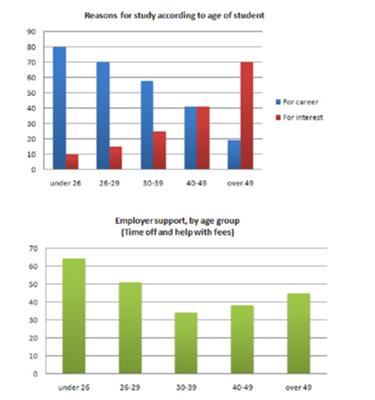

The first graph shows that there is a gradual decrease in study for career reasons with age. Nearly 80% of students under 26 years, study for their career. This percentage gradually declines by 10-20% every decade. Only 40% of 40-49yr olds and 18% of over 49yr olds are studying for career reasons in late adulthood.
Conversely, the first graph also shows that study stemming from interest increases with age. There are only 10% of under 26yr olds studying out of interest. The percentage increases slowly till the beginning of the fourth decade, and increases dramatically in late adulthood. Nearly the same number of 40-49yr olds study for career and interest. However 70% of over 49yr olds study for interest in comparison to 18% studying for career reasons in that age group.
The second graph shows that employer support is maximum (approximately 60%) for the under 26yr students. It drops rapidly to 32% up to the third decade of life, and then increases in late adulthood up to about 44%. It is unclear whether employer support is only for career-focused study, but the highest level is for those students who mainly study for career purposes.
==================================================
IELTS buddy
Feedback
It’s a very good answer with few mistakes, so there is not much I can add to what you have done.
Organization
This is good as you have clearly divided up the information and you have good topic sentences.
vocabulary and grammar
You have some good use of vocabulary e.g. ”late
You have few grammar errors (only one I noticed) and you have some complex sentences in. You could maybe try and fit some more in.
For example, you could do this in your second body paragraph:
Although there are only 10% of under 26yr olds studying out of interest, the percentage increases slowly till the beginning of the fourth decade, and increases dramatically in late adulthood.
However, you do have two important things missing.
1.Introduction
You should have a sentence at the beginning that introduces the graph. For example:
The bar chart shows the reasons why people studied and the level of support given by their employer according to different age groups.
You should use the title of the graph you will be given in the exam to do this. However, DON’T copy it straight from the rubric. You have to put it in your own words.
2.Main Trends
At the beginning, before you go into detail, you should also point out the main trends of the graph. For example:
Overall, it can be seen that most younger people study for career, whilst older people study for interest, and the most support from employers is given to under 26 years olds.
You have done a similar thing with your topic sentence anyway, but it would be a good idea to have an overview in your introduction (or put it in a conclusion) as well.
Follow this link to see examples of graphs and example graph introductions:
Task 1 writing samples
Comments for Task 1: Bar Chart Reasons for Studying
|
||
|
||
Task 1 IELTS Sample: Reasons for study and employer support
by dravid
(thailand )


The charts show the main reasons for study among students of different age groups and the amount of support they received from employers.
The bar chart illustrates the reasons why people study and the second chart shows the level of support given by their employer according to different age group
Overall, it can be seen that more people are keen on studying to building their careers, even though it tends to decline as they grow up. It can be also seen that employers support is maximum for those who are under 29. 70% 80% of students below 26 study to build their careers and this figure tends to decline as they grow older, dropping to 70% for the ages 26-29, 40% for the ages 40 -49, and finally dropping falling to about 20% when people are over 49. By contrast, studying for interest increases from ages to ages over the age groups, rising from nearly 10% to a dramatic peak (70%) where when people finally reach above 49
Moving on to the next chart, it is crystal clear that employer support is very high when people are above 26 years of age. Unfortunately, this figure drops to 50% for the ages (26-29) and finally little over 30%(30-39). However, there is tendency to increase in receiving employers’ support for the next two age profiles.
==================================================
IELTS buddy
Feedback
Corrected Version:
The first bar chart illustrates the reasons why people study and the second chart shows the level of support given by their employer according to different age groups.
Overall, it can be seen that more people are keen on studying to building build their careers, even though it tends to decline as they grow up. It can be also seen that employers support is maximum for those who are under 26.
70% 80% of students below 26 study to build their careers and this figure tends to decline as they grow older, dropping to 70% for the ages 26-29, 40% for the ages 40 -49, and finally dropping to about 20% when people are over 49. By contrast, studying for interest increases from ages to ages over the age groups, rising from nearly 10% to a dramatic peak (70%) where when people finally reach above 49.
Moving on to the next chart, it is crystal very clear that employer support is very high when people are above 26 years of age. Unfortunately, this figure drops to 50% for the ages 26-29, and finally a little over 30% for the 30-39 age group. However, there is tendency to increase in receiving employers’ support for the next two age profiles.
Overall it's a good answer as your response is easy to follow and you decribe and contrast the key data. You also have some good complex sentences in there. Just a few things to note:
Look at the data on the graph carefully - you make a few mistakes with incorrect data taken from the graph. This may affect your score.
crystal clear = this is too informal for academic writing
Careful how you use brackets:
dropping to 70% for the ages ( 26-29), 40% for the ages (40 -49),
Unfortunately, this figure drops to 50% for the ages (26-29) and finally a little over 30% (30-39).
These need to be a part of the sentence.
Try to vary your language - you say 'drop' three times, which is why I changed one to 'fall'
Comments for Task 1 IELTS Sample: Reasons for study and employer support
|
||
|
||
|
||
|
||
|
||
Task 1 Bar Chart: Reasons for Studying and Levels of Support
by Tahir
(Patel)


The bar charts illustrate the reasons why students study and the level of support they get from their employer.
The first chart gives information about the purpose for study among various age group students,while the second chart shows help given by employers to them.
It is clear that younger students(under 26) study for their career,whereas those over 49 study for just interest.Employers provide supports mainly to under 26 age group.
Four out of the five students get education to develop their career in age group under 26.These numbers decrease as age groups increase.Just under 20 percent of students with age over 49 study for career.By contrast,the number of students study for interest are highest for those with age over 49,whereas lowest for under 26 year olds.
The employers give more support to under 26 group.The age group 30-39 gets lowest support but the age group 26-29,40-49 and over 49 get better amount of support then age group 30-39.
===============
IELTS buddy
Feedback:
First some comments:-
"It is clear that younger students(under 26) study for their career,whereas those over 49 study for just interest.Employers provide supports mainly to under 26 age group."
This is ok, but you should try to be more accurate. If you look at the graph, actually age 30-39 study for career as well, and age 40-49 is equal.
You would be better to make it more general - e.g.
"It is clear that younger students generally study for their career, whereas those over 49 study for just interest, and employers provide supports mainly to under 26 age group."
“Four out of the five students” – I don’t get this. Don’t you mean 80%?
“By contrast,the number of students study for interest are highest for those with age over 49,whereas lowest for under 26 year olds.”
You are repeating yourself in this last part – “whereas....year olds”. You said about 26 years olds in the sentence before:
"Just under 20 percent of students with age over 49 study for career"
Refer to the Data
Make sure you make reference to the data (percentages) on the left. You don’t have to do this all the time, but you must make reference to it at some points so we know what you are comparing with what.
You don’t mention it at all in you last paragraph about the ‘employer help’ graph, and minimally in the first one.
The IELTS scoring specifically states that the student must mention the data.
============
Grammar corrected version:
The first chart gives information about the purpose for study among various age groups of students, while the second chart shows help given by employers to them.
It is clear that younger students (under 26) study for their career, whereas those over 49 study for just interest. Employers provide support mainly to the under 26 age group.
80 per cent of the students get education to develop their career in the under 26 age group. These numbers decrease as age groups increase. Just under 20 percent of students aged over 49 study for their career. By contrast, the number of students studying for interest are highest for those aged over 49, whereas it is lowest for under 26 year olds.
The employers give more support to the under 26 group. The age group 30-39 gets lowest support but the age groups 26-29, 40-49 and over 49 get a better amount of support than the 30-39 age group.
==============
Overall, it’s a fairly good answer as you pick out all the key information without going into too much detail, and you seem to cover everything in the graph.
You don’t have many grammar errors either.
And you divided the information up into two body paragraphs which is good.
You also have an overview that gives the main points of both graphs and a good introductory sentence
To improve:
You make some reference to the data on the left, but not enough.
Your answer is actually too short (about 140 words I think) which will lose you some score.
Also, you should try to make more use of ‘complex sentences' as the examiner will be looking for this. You do use ‘while’ and ‘whereas’ but you should try to have a few more.
But this depends what band you want. If its only a ‘6’, then you don’t need much more than you have, but you will still need a variety (see the public band descriptors).
Have a look at some of the task 1 sample / model answers written on this site and see how complex sentences have been put in. Don’t try to put lots in for the sake of it, especially ones you are not sure how to use, as this may end up lowering your score if you make lots of mistakes.
But try to practice how you can add some others (e.g. relative clauses).
Hope that helps
Comments for Task 1 Bar Chart: Reasons for Studying and Levels of Support
|
||
|
||
|
||
|
||
IELTS Bar and Pie Chart - Reasons for Study and Costs
by Aleyna Arzu
(Turkey)


The charts below show the result of a survey of adult education. The first chart shows the reason why adults decide to study. The pie chart shows how people think the costs of adult education should be shared.
Summarize the information by selecting and reporting the main features and make comparisons where relevant.
The charts illustrate the results of a survey of adult education.
As it can be seen from the table below, the main reason for adult education is interest in subject that accounts for 40% of the rest factors. Approximately 38% of the participants represent gaining qualifications as the most second important reason. Adult education appears to be useful for present jobs of 22% of the people participating in the survey. The other reason is to enhance the possibility of getting higher positions in work and to enjoy learning that constitute 20% for each. For 12% it is preferable to continue education, as it can create opportunities for shifting jobs. Just 9% are interested in meeting new friends through adult education.
When it comes to pie chart, it shows sharing the costs of adult education. According to the pie chart, individual presides over the rests with 40%. Employer accounts for 35%, while taxpayer 25%.
Comments for IELTS Bar and Pie Chart - Reasons for Study and Costs
|
||
|
||
|
||
|
||
IELTS Graph - Reason for Study and Sharing of Costs
by uzma abbas
(lahore)


The charts show the result of a survey of adult education. The first chart shows the reason why adults decide to study. The pie chart shows how people think the costs of adult education should be shared
The bar chart illustrates the proportions of the decisional views regarding indications for education among young individuals and the pie chart represents the supposed budget allocation of each educational course on individual basis. At the first glance, it can be seen that major reason for adult education is interest in subjects (40%) and the very same proportion should be shared by individuals for each course.
To begin, the bar chart shows that around 38-40% of adults decide to study to gain qualifications and due to interest in subjects respectively. While according to 20-22% of people, they find the adult education necessary to enjoy learning, to improve promotional prospects and to find it helpful for the current job respectively. Very small proportion of adults is with the views to meet people and for changing job purposes.
By far, the pie chart shows that 40% of the educational course cost should be the responsibility of individuals, 35 % should be paid by employers and about a quarter should be allocated to taxpayers.
You can feedback below on this IELTS Graph about the Reason for Study and Sharing of Costs.
Comments for IELTS Graph - Reason for Study and Sharing of Costs
|
||
|
||
|
||
|
||
|
||
|
||

Band 7+ eBooks
"I think these eBooks are FANTASTIC!!! I know that's not academic language, but it's the truth!"
Linda, from Italy, Scored Band 7.5


Bargain eBook Deal!
30% Discount


All 4 Writing eBooks for just $25.86
Find out more >>
IELTS Modules:
Other Resources:


Recent Articles
-
Free IELTS Essay Checker: Instant and No Login Required
Mar 26, 26 08:30 AM
Free IELTS essay checker giving you an instant overall band score, detailed scores for all IELTS writing criteria, example errors, and clear suggestions to improve your Task 2 essay. -
IELTS Bar Chart: Average Number of Coastal Flood Events per Year
Mar 10, 26 05:34 AM
 The chart below shows the number of flood events in four different cities in the United States during four different periods. The bar graph depicts the
 -
Should Everyone Learn English
Mar 10, 26 05:32 AM
I would be pleased if someone could provide feedback. I want to know if my essay well-structured and the exact band. Learning English at school is often


Important pages
IELTS Writing
IELTS Speaking
IELTS Listening
IELTS Reading
All Lessons
Vocabulary
Academic Task 1
Academic Task 2
Practice Tests
Connect with us

Before you go...
30% Discount - Just $25.86 for all 4 Writing eBooks

Copyright © IELTSbuddy All Rights Reserved
IELTS is a registered trademark of University of Cambridge, the British Council, and IDP Education Australia. This site and its owners are not affiliated, approved or endorsed by the University of Cambridge ESOL, the British Council, and IDP Education Australia.