IELTS Line Graph - UK Fast Food Consumption
by uzma abbas
(lahore)
, in the UK from 1970 to 1990.")

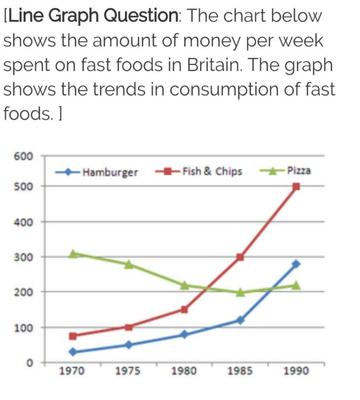
The graph gives information about the consumption of fast food (in grams per week), in the UK from 1970 to 1990.
The bar graph represents the weekly expenditure on three categories of fast food according to income groups in britain while the line graph illustrates the total consumption of these fast foods in the time period of 20 years between 1970-1990.
Overall, it can be seen that hamburger is the favorite fast food between high and average income groups and that its consumption has gotten a sharp rise over the time span of 20 years.
At first, the bar graph shows the expenditure comparison among hamburgers, fish & chips and pizza. Hamburger is the highly consumed food in high and average income groups where it costs 40 and 32 pence per week respectively. Contrary, in low income group, more money is spent on fish and chips around 17% which corresponds to the money spent on them in high income group. Pizza expenditure has a gradual falling trend from high to low income groups which is 20%, 12% and 6% respectively.
On the other hand, the line graph depicts that fish and chips were the highly consumed fast food in 1970, consumption 300 gms but with the passage of time, its consumption showed a gradual descending trend till 1990 when it reached around 200gms. While hamburger and pizza showed increasing trend, in which hamburger showed an abrupt rise and reached at 500 gms till 1990. Pizza consumption took a steep rise and could just reach at 220 gms which is the same as the most lowest level of fish and chips consumption.
Please give comments below on your thoughts about this graph.
You may be able to help the student improve their IELTS score.
Comments for IELTS Line Graph - UK Fast Food Consumption
|
||
|
||
|
||
|
||
|
||
|
||
|
||
|
||
|
||
Australian Fast Food Consumption
by Ala
(Oxford United Kingdom )
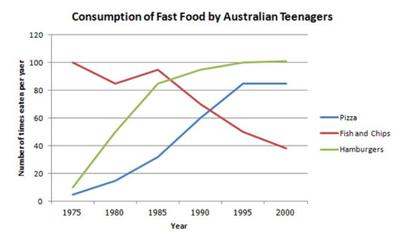

The graph illustrates, the changes in Consumption of fast food by the Australian Teenagers, including three types of food, Pizza, Fish and chips and Hamburgers, between 1975 and 200 . A period time of 25 year.
In 1975, there was an increase in each of Pizza and Hamburgers except the Fish and Chips went down. In 1980, It's still the same as before, for the Pizza and Hamburgers expect Fish and Chips still dropped down slowly as which shows in the graph. From 1985 to 1990 the Fish and Chips decline for about 30 per-cent and Pizza and Hamburgers still rise From 20 per-cent to 40 per-cent for Pizza and 57 per-cent for Hamburgers which demonstrates in the graph below. From 1995 to 2000 as we see the Pizza and Hamburgers still steady remains as the same number of times eaten per year. I think if the people didn't make any solution for this problem may Fish and Chips well not go make again.
Comments for Australian Fast Food Consumption
|
||
|
||
Spending on Food and Restaurants
by Alikung


The charts show the percentages of their food budget the average family spent on restaurant meals in different years. The graph shows the number of meals eaten in fast food restaurant and sit-down restaurant.
The pie charts describe the budget percentages of average family for their foods in restaurant and home cooking meals between 1970-2000 periods. Furthermore, there is a line graph that indicates the number of meals per year were eaten by people in fast food restaurant compared by sit-down restaurant in the same periods.
In the beginning of this period, the family cost domination was spent for home cooking meals (10%), although, the different condition occurred in 2000, while the food restaurant allocation reached the peak and dominate the budget, for about one out two parts. Through this term, the consumption of restaurant foods continued to rose steadily about 5-15% for each next years. In 1970, amount of meals were eaten in fast food as much as sit-down lounge (20), otherwise in the end of this term, fast food reached the peak and lead the markets with sharp increases along the years. Sit-down restaurant foods have same trended as fast food, however, the rising less than that.
Please give your comment, thank you.
Comments for Spending on Food and Restaurants
|
||
|
||
|
||
|
||
IELTS Line Graph - Fast Food Consumption
by kuttiana84
(scottland)


The line graph shows changes in the amount and type of fast food consumed by Australian teenagers from 1975 to 2000.
The line graph depicts variations in the fast food consumed by Australian teenagers between 1975 and 2000. Unit is given in number of times eaten per year.
Overall, it can be seen that intake of hamburgers and pizza has increased while that of fish and chips has fallen down during the period.
To begin, the consumption of hamburgers and pizza stood at around 10 in 1975. Over the next 20 years, there was a gradual rise in their uptake with hike in the former was much more than the latter reaching to approximately 100 and 85 respectively in 1995. Thereafter, the figures remained steady till the end of the period.
In contrast, the utilization rate of fish and chips which was 100 in 1975, fluctuated in the next two years and thereafter showed a dramatic decrease to reach the trough of around 40 in 2000, which was the lowest among all the three during that period.
Help this student to improve their score by proving feedback below on this IELTS Line Graph about Fast Food Consumption.
Comments for IELTS Line Graph - Fast Food Consumption
|
||
|
||
Fast Food
by isabelle
The line graph illustrates the fast food consumption by Australian teenagers between the years of 1975 and 2000. In overall, hamburger and pizza consumption shows almost parallel increase with slight changes.
To begin with, it can be said that fish and chips consumption is the only component as fast food that decreases rather than pizza and hamburger. Other than the slight increase between 1980 and 1985, apparently Australian teenagers reduces eating fish and chips. There is an obvious and drastic difference comparison to the other fast food lines in the chart.
secondly Hamburger is the most favorite fast food of young adults especially between the years of 1975 and 1985. after 1985, hamburger’s popularity seems to be decreased and in the year of 1995 pizza could catch with hamburger's charm.
Also, starting from 1995 hamburger and pizza shows a parallel path way for the next 5 years, however hamburger’s number of eaten times is still higher than the pizza and there is an extreme difference hamburger and fish and chips consumption numbers at the year of 2000.
Finally it is obvious that Australian teenagers like hamburger and pizza way better than the fish and chips.
Consuming Fast Food
by Jeehan
You should spend about 20 minutes on this task.
The line graph below shows changes in the amount and type of fast food consumed by Australian teenagers from 1975 to 2000.
Summarize the information by selecting and reporting the main features and make comparisons where relevant.
Write at least 150 words.
The line graph represent the number of times Australian teenagers consumed three types of fast food- pizza, fish and chips and hamburgers between 1975 to 2000, over 25 years. Overall, fish and chips was the most popular fast food among three which had dropped the popularity over the period whereas, pizza and hamburgers were being popular this time.
In 1975, fish and chips was consumed in high rate about 100 times per year. In contrast, pizza and hamburger were consumed at below 10 times a year. Consumption rate of fish and chips was fluctuated for 10 years between 80 to 100 times. Then suddenly, the consumption rate was decreased rapidly to approximately 40 times over 15 years.
On the other hand, consumption rate of pizza and hamburgers were increased gradually in a similar pattern during this 25 years. Hamburger was eaten higher than the pizza, 100 and 82 times respectively. Pizza consumption remained constant for the last 5 years whereas, hamburgers reached a peak at 100 times as like fish and chips was.
Fast Food Consumption
by Bugra IZCI
(Turkey)
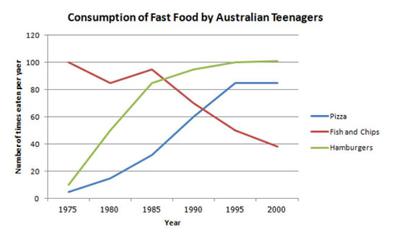

The line of graph below shows changes in the amount and type of fast food consumed by Australian teenagers from 1975 to 2000
The line of graph shows us that Australian teenager consume fast food. This graph prepare according to data between 1975 to 2000.
In beginning of 1985, the rate of eaten fish and chips were decreased sharply whereas rate of eaten hamburger were started to increased constantly.
In 1975, fish and chips were more popular fast food than pizza. In that period of graph pizza almost were not eaten. After that, fish and chips were started to lose their popularity for teenagers in beginning 1980s, and teenagers have discovered taste of pizza. That issue continued like that pizza were increased gradually.
On the other hand, increased of hamburger were more sharply than pizza in a period of 25 years. In 1985, Australian teenagers have decided hamburger, being eaten 85 times a year, whereas rate of eaten pizza was lower than hamburger. Teenagers just eaten pizza 25 times a year.
Line Graph - Fast Foods
by Khabibullo Khojiboyev
(Tashkent, Uzbekistan)

Can you give this candidate feedback on their graph answer?
The graph gives information about the quantity of money spent on 3 different fast foods which were consumed in Britain and measures for a week.
Overall, It is clearly noticeable that Pizza was the most consumed food at the beginning, at 300 per week. However, after 1980, it gave away its position to Fish & Chips.
Regarding to the Hamburger and Fish and Chips, There were a considerable growth till 1980 after that these points doubled.Another interesting point is that in around 1980 there was a crash between Pizza and Chips & Fish before which Pizza started a gradual decrease. Meanwhile, Hamburger showed the lowest points (around 300) in every decade. Interestingly, It outweigh even Pizza which hit the highest amount in the beginning, at around 300. Finally, Fish & Chips caught the highest amount with 500 for a week, while Pizza hit the rock bottom

Band 7+ eBooks
"I think these eBooks are FANTASTIC!!! I know that's not academic language, but it's the truth!"
Linda, from Italy, Scored Band 7.5


Bargain eBook Deal!
30% Discount


All 4 Writing eBooks for just $25.86
Find out more >>
IELTS Modules:
Other Resources:


Recent Articles
-
Free IELTS Essay Checker: Instant and No Login Required
Mar 26, 26 08:30 AM
Free IELTS essay checker giving you an instant overall band score, detailed scores for all IELTS writing criteria, example errors, and clear suggestions to improve your Task 2 essay. -
IELTS Bar Chart: Average Number of Coastal Flood Events per Year
Mar 10, 26 05:34 AM
 The chart below shows the number of flood events in four different cities in the United States during four different periods. The bar graph depicts the
 -
Should Everyone Learn English
Mar 10, 26 05:32 AM
I would be pleased if someone could provide feedback. I want to know if my essay well-structured and the exact band. Learning English at school is often


Important pages
IELTS Writing
IELTS Speaking
IELTS Listening
IELTS Reading
All Lessons
Vocabulary
Academic Task 1
Academic Task 2
Practice Tests
Connect with us

Before you go...
30% Discount - Just $25.86 for all 4 Writing eBooks

Copyright © IELTSbuddy All Rights Reserved
IELTS is a registered trademark of University of Cambridge, the British Council, and IDP Education Australia. This site and its owners are not affiliated, approved or endorsed by the University of Cambridge ESOL, the British Council, and IDP Education Australia.