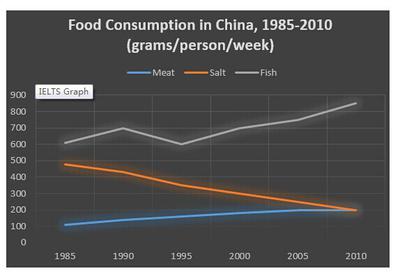
IELTS Line Graph - The amount of food eaten by Chinese consumers
by jack chen - wu ze tian
(nan jing)

The graph below shows the changes in food consumption by Chinese people between 1985 and 2010.
Summarise the information by selecting and reporting the main features, and make comparisons where relevant.
can i get a band 8 for my graph?
The line graph compares the amount of food eaten by Chinese consumers from 1985 to 2010.
Overall, it can be seen that fish was consumed the most by Chinese people. In addition, the consumption of salt gradually decreased over a 25-year period, while the amount of meat eaten grew steadily.
In 1985, nearly 600 grams of fish was consumed by average Chinese person, but this number was much higher than either salt or meat, at just under 500 grams and only 100 grams respectively. Despite a slight decrease of fish consumption between 1990 and 1995, its figure remained strong growth over the period to reach the top, at approximately 850 grams in 2010.
As the time passed by, the consumption gap between salt and meat was narrowed. The amount of salt eaten declined significantly from 500 grams in 1985 to only 200 grams in 2010. By contrast, the amount of meat consumed rose steadily throughout the period, and its figure finally reached to the same level as salt by 2010.
Comments for IELTS Line Graph - The amount of food eaten by Chinese consumers
|
||
|
||
Amount of food eaten by Chinese people between 1985 to 2010
by hael
(uae)
Please provide feedback:
The graph shows the amount of food eaten by chinese people between 1985 to 2010.
Obviously seen that there were 600 people in China by year 1985 eating fishes.However there was fluctuation between 1990 to 1995,but plummeted every 5 years.Looking back to 1985 people in china were not fond of putting spices like salt in their dishes,as noticing on it there was a sudden declined of food consumption.
Looking for the meat eaten by Chinese there were only 100 grams consumed in 1985 and slowly rising every 5 years until it reaches 25 years. In addition to that it just doubled the gram consumed.
In summary,Chinese people were very conscious of their diet,as we could notice on their body structure most of them they are slims and petite. In a survey hypertension and obesity is not the leading problem in there country. Chinese people tend to eat fishes with low salt in their diet,wit a very rare meat consumption that is why people in China maintain an awesome healthy body.


