Pie Chart Revenue
by Kristina
(United Kingdom)
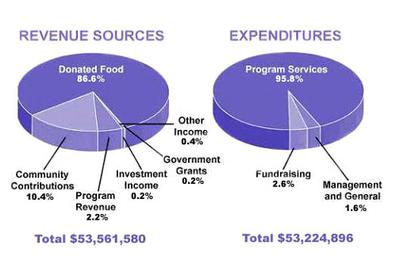

Revenue Sources and Expenditures of a USA Charity in one year, 2016.
The pie chart demonstrates the revenue sources the USA Charity was allocating and the origin of costs it was experiencing. The most important fact is the total income was eventually larger than expenses, generating a profit in slightly more than 200 thousand dollars.
According to the first pie of the diagram, the Donated Food was the major source of the Charity and it takes up considerably more than four-fifths in relation to other income flow categories. While referring to the expenditures chart almost all of them are noticeably making up the Program Service. Having stated that, it is clear that the Charity mainly concentrated on the performance and delivering the service for the period of one year.
Important to provide some details about the sources being used but indicating the much smaller per cent. The Community Contributions is approximately eight times less than the source mentioned first, but still, it had more influence than Program Revenue which is just above 2 per cent of the total. Likewise, Fundraising and Management and General costs contribute to the sum the Charity spent showing nearly similar figures.
The minor support was provided by the Investment, Government Grants and other evaluating in less than 5.356 158 in total, but eventually, the Charity earned surplus spending a large amount of money on in the USA for one 2016th year.
Pie Chart - Revenues
by abdo
(egypt)
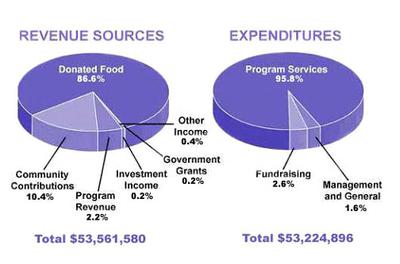

The figure shows the difference between revenues and expenses for children charity in 2016.
It is obviously that there the revenue is higher than expenses by about 340 million US $ leading to positive profit in financial statement. The figure illustrates that the most item consuming money is program services by 95.5 % on contrast the lowest one is management and general by 1.6 % while other expenses is payed for fundraising by 2.6%. It is also elicited from figure that the most revenues come from donated food providing about 86.6% of revenue and the successive item is community contributions by 10.4% while other revenue is submitted from different sources.

Band 7+ eBooks
"I think these eBooks are FANTASTIC!!! I know that's not academic language, but it's the truth!"
Linda, from Italy, Scored Band 7.5


Bargain eBook Deal!
30% Discount


All 4 Writing eBooks for just $25.86
Find out more >>
IELTS Modules:
Other Resources:


Recent Articles
-
Free IELTS Essay Checker: Instant and No Login Required
Mar 26, 26 08:30 AM
Free IELTS essay checker giving you an instant overall band score, detailed scores for all IELTS writing criteria, example errors, and clear suggestions to improve your Task 2 essay. -
IELTS Bar Chart: Average Number of Coastal Flood Events per Year
Mar 10, 26 05:34 AM
 The chart below shows the number of flood events in four different cities in the United States during four different periods. The bar graph depicts the
 -
Should Everyone Learn English
Mar 10, 26 05:32 AM
I would be pleased if someone could provide feedback. I want to know if my essay well-structured and the exact band. Learning English at school is often


Important pages
IELTS Writing
IELTS Speaking
IELTS Listening
IELTS Reading
All Lessons
Vocabulary
Academic Task 1
Academic Task 2
Practice Tests
Connect with us

Before you go...
30% Discount - Just $25.86 for all 4 Writing eBooks

Copyright © IELTSbuddy All Rights Reserved
IELTS is a registered trademark of University of Cambridge, the British Council, and IDP Education Australia. This site and its owners are not affiliated, approved or endorsed by the University of Cambridge ESOL, the British Council, and IDP Education Australia.