- Home
- Sample Graphs
- Writing Task 1 Table Sample
Writing Task 1 Table Sample
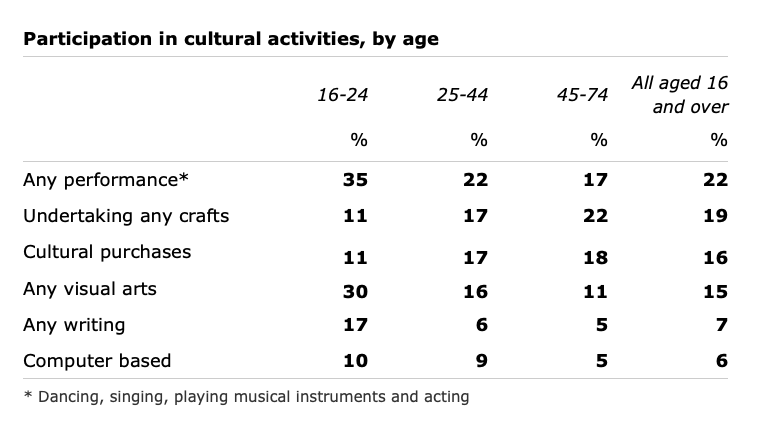
This writing task 1 table sample compares the participation in cultural activities across three ages groups.
Tables are not as visually clear as graphs, pie charts etc. as you are presented with lots of numbers, which can make it more difficult to immediately see what patterns there are to make comparisons.
So you have to look at the data carefully to work out how you will organise it into logical groups and paragraphs.
Writing Task 1 Table Sample
You should spend about 20 minutes on this task.
The Table below shows the results of a survey that asked 6800 Scottish adults (aged 16 years and over) whether they had taken part in different cultural activities in the past 12 months.
Summarise the information by selecting and reporting the main features and make comparisons where relevant.
Write at least 150 words.

Model Answer
The table illustrates the results of research undertaken in Scotland with adults aged from 16-74 to assess their involvement in a variety of cultural activities over a 12-month period. Overall, it is evident that participation in any performance and crafts were the most popular for all age groups.
The highest participation in any activities was seen in the 16-24 age group, with 35% and 30% respectively doing performance and visual arts. In contrast, other activities were much lower, particularly those computer-based, at only 10%.
Turning to the older age groups, like the under 25s, the highest participation rate seen for 25-44 years olds was in performance, though this was much lower, at only 22%. A similar rate of 22% was evident for the most popular activity for the 45-74 age group, which was crafts. Again, the popularity of computers was very low for all those who were 25 plus, as was interest in writing.
Taking all age groups together, it can be seen that performance and crafts were the most popular, at over 19%, whereas cultural purchases and visual arts were slightly less popular at 16% and 15% respectively. Finally, little interest was shown in writing and computing.
(196 Words)
Comments
The writing task 1 table sample has all the elements to get a high score for IELTS.
There is a clear introduction to the graph (paraphrasing, not copying, the rubric) and then an overview that selects key changes / trends in the table.
It is well-organised and thus clear to follow and read, with the paragraphs arranged around age groups (There is usually various ways to organise your answer but you must make sure when you make your choice it is logical and will not leave the examiner getting lost or confused as they attempt to read it).
At various points in the IELTS table, comparisons are made between the various age groups, something which you are specifically asked to do in the rubric.
The description refers to data / figures from the graph to highlight the key trends, something else you must also do.
There is also a good mix of vocabulary and a range of sentences types and structures in the writing task 1 table sample used in order to show flexibility and skill with lexis and grammar.
Comments
Any comments or questions about this page or about IELTS? Post them here. Your email will not be published or shared.


